
Update, September 2026: This post covers the first version of trce, which captured and shared coding-agent runs. I have since shifted trce toward helping teams review the skills their coding agents use, standardize what works, and spot drift. The old trace viewer and CLI are being retired. You can follow the new product at trce.sh.
In the previous post, I built a tiny agent harness from scratch to understand how it works.
The deeper I went, the more curious I became about the coding agents I use daily.
What is actually happening behind the terminal window?
Could I tap into a run and make sense of the long trail it leaves behind?
I wanted to see when an agent spawned a subagent, which MCP tools it called, what shell commands it ran, where it requested approval, and how many tokens each step consumed.
So I built the original trce, an open-source CLI that turned Codex and Claude Code sessions into structured traces.
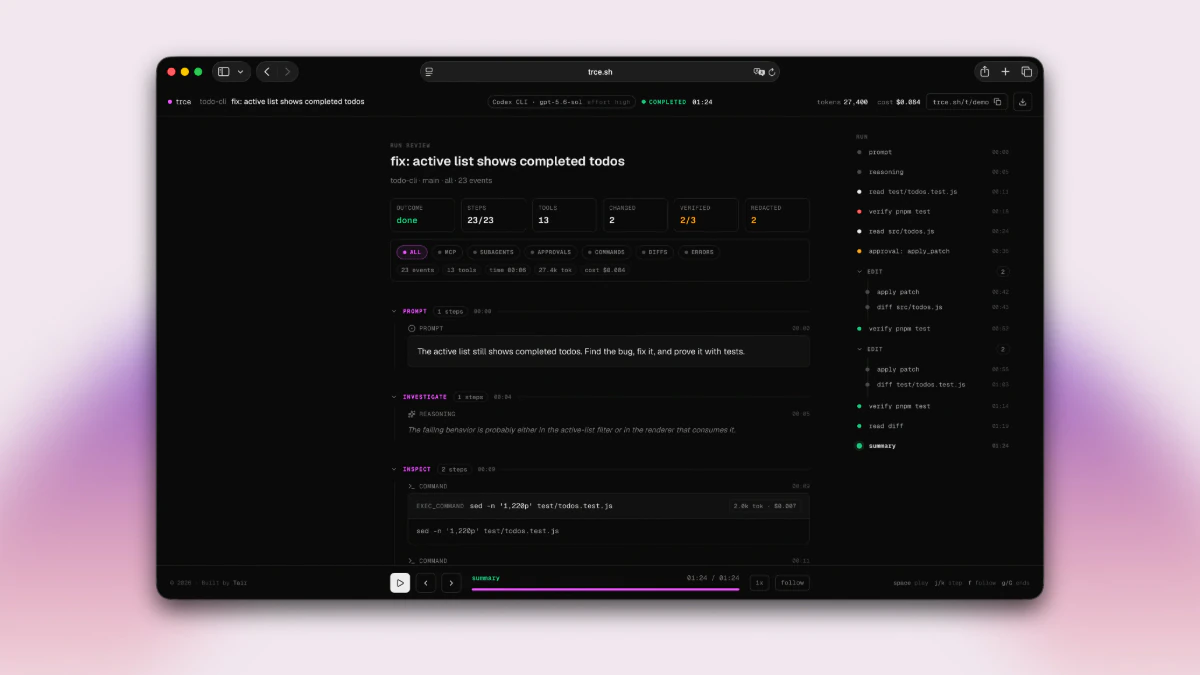
I also built a companion web app to share and inspect traces. It added live viewing, event grouping, replay, and filters for commands, diffs, approvals, MCP calls, and subagents.
The web app is not open source yet. I am still figuring out the best way to represent long runs without turning them into another log viewer.
This was the original demo trace:
Once I could inspect a run, the practical value became clear.
If agent work becomes legible, we can debug and optimize harnesses, design better approval flows, compare runs, integrate with other systems, and attach policies to what agents actually do.
Hooks expose the agent lifecycle
The first thing I learned is that coding-agent CLIs already expose meaningful data.
Claude Code has hooks with events for session start, user prompts, tool use, permission requests, compaction, subagents, and session end.
Codex has hooks too. A hook receives structured JSON when something happens inside the harness.
That was the first “aha” moment. I did not need to scrape the terminal. I could simply attach to the harness boundary.
That boundary exposes things like:
- a prompt entering the run
- a tool about to execute
- a command finishing
- an approval being requested
- a subagent starting
- context being compacted
- a session stopping
A terminal recording shows what the UI printed. A hook captures a structured event in the agent lifecycle.
Hooks do not contain the entire run. Codex does not expose every tool path through hooks, and neither hook stream contains every model-visible message.
But hooks gave me structured events the terminal could not.
How trce captures a run
trce init adds hooks to the harness configuration. When an event happens, the harness calls a tiny command. For example, PreToolUse runs:
trce spool --harness claude-code --event PreToolUseThe payload arrives as JSON on stdin. trce spool adds a small envelope, appends one line under ~/.trce/spool/, and exits:
{"at":"2026-07-09T10:00:00.000Z","harness":"claude-code","event":"PreToolUse","payload":{"tool_name":"Bash","tool_input":{"command":"pnpm test"}}}The agent waits for trce spool to exit before continuing, so I designed the command to do as little work as possible. It does not use the network or parse, redact, or render the full session.
When you prepare or share a trace, the CLI writes a redacted trace.json (known secret patterns and values from local .env* files are masked), a redaction report, and a standalone HTML preview under ~/.trce/shares/<session-id>/.
The JSON is portable. You can inspect it directly, send it to an LLM, or integrate it with another system. Nothing left your machine unless you explicitly published it to the companion app, which created the shareable web view.
The main workflow uses a few CLI commands and flags:
trce init
  -> install local harness hooks

agent runs
  -> trce spool appends hook events locally
  -> native transcript or rollout stays on disk

trce share --latest --local
  -> find the latest session
  -> join hooks with native session data
  -> normalize and redact
  -> write trace.json and a standalone HTML preview

trce share --latest
  -> publish the same redacted trace

trce share --latest --live
  -> publish existing events, then follow new ones
trce help lists the full set of commands and options.
Hooks and native session files
Hooks turned out to be only half of the input.
Claude Code and Codex already write their own local session files while they run. trce does not create these files.
Claude Code writes a transcript under ~/.claude/projects/... and Codex under ~/.codex/sessions/....
Both use JSONL: one structured record per line. These records contain messages, reasoning, tool calls, results, file changes, and token usage.
These are internal formats and can change between versions. They are useful inputs, but not stable APIs.
But they do not contain every harness event. Approvals, for example, come from hooks.
Hook payloads include the path to the native session file. trce stores that path in its local spool. When you prepare or share a trace, it reads the native file, adds approval and session events from the hooks, and removes overlapping records.
native session file + hook events -> normalized traceThe native session file provides most of the run. Hooks add the lifecycle events it missed.
Turning raw records into a trace
Claude Code and Codex often describe the same action differently.
Claude Code may record a shell call as Bash. Codex records it as an exec_command. trce maps both into a command event:
{"type":"tool_call","payload":{"callId":"call_42","view":"command","input":{"command":"pnpm test"}}}
{"type":"tool_result","payload":{"callId":"call_42","exitCode":0}}
The callId connects the action to its result. The trace schema also covers messages, reasoning, file changes, approvals, usage, MCP calls, and subagents.
This gives the web viewer, an LLM, or another system one format to read. They do not need to understand how each harness stores its sessions.
But normalization is not just renaming fields.
The first Codex session I traced while building trce produced 524 events. Many were internal bookkeeping rather than useful actions or outcomes.
Assistant messages appeared twice. The agent changed files, but the viewer reported changed 0 because the file paths were buried inside raw patch data.
I changed the adapter to remove duplicate runtime events and turn patches into per-file changes with paths, diffs, and line counts.
That taught me that not every native record belongs in a trace. A useful trace keeps the actions and outcomes someone needs to understand the run, while leaving out internal bookkeeping and duplicates.
What I learned
Building trce helped me see what actually happens behind the scenes when an agent runs. Hooks and native session files already expose plenty of structured data. Turning it into a clear trace makes different harnesses easier to understand and compare.
Once a run becomes legible, we can debug why an agent failed, see where it spent its context, improve approval flows, compare harnesses on the same task, send structured output to other systems, and check policies against what the agent actually did.
That is what makes traces interesting to me. They are more than logs or replays because they provide feedback for the harness around the model.
I am now applying the same idea one step earlier: understanding which skills coding agents load, where they drift, and what teams should standardize. You can follow the new trce at trce.sh.
If there is something else you want to see in your traces, or an idea you think I should explore, send me a DM on X.